
Statistics and reports
Statistics
pro.pyryx.com/statistiquesSee this screen in the demo
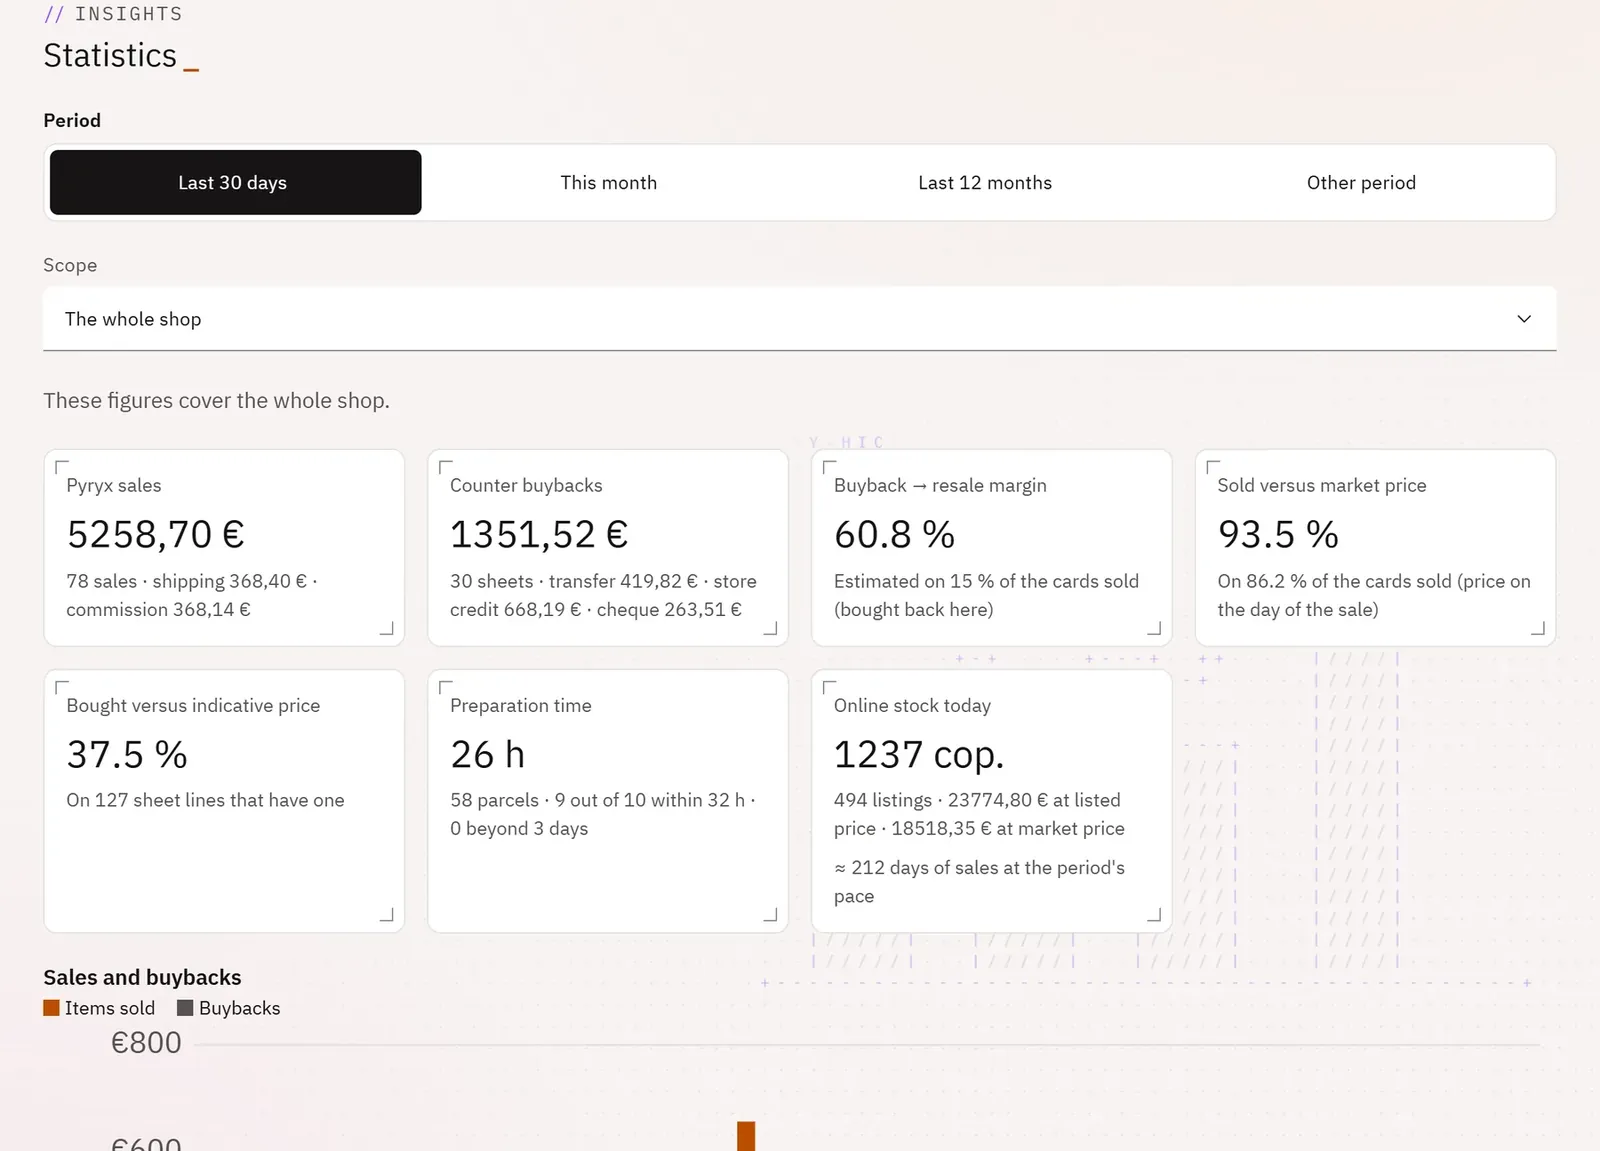
Your shop’s figures over the period of your choice: online sales, counter buybacks, margin, preparation time and stock. Enough to know where you stand without a spreadsheet.
 1234
- 1Choosing the period
- 2Pyryx sales
- 3The buyback → resale margin
- 4Sales and buybacks over time
What you can do
- A period: last 30 days, this month, last 12 months, or from one date to another.
- The whole shop or a single store.
- Tiles: sales, buybacks, estimated margin, selling and buying prices compared with the market price, preparation time, online stock and the days of sales it represents.
- Charts: sales and buybacks, sales by game, by condition, best-selling sets, listing age; the table of best-selling cards.
Step by step
- Open Statistics.
- Choose the period, for example Last 12 months.
- Read the tiles, then scroll down to the charts and the best-selling cards.